Supply chain intelligence
I redesigned a legacy supply-chain reporting workflow into a scalable enterprise report that helped retail teams analyze performance across product, store, and distribution hierarchies in one place.


Overview
Creating an advanced analytical and AI-infused solution, which can quickly and preemptively prevent supply chain disruptions, maintain on-shelf availability, and improve future forecasting, planning and management.
Optimize cost and improve top-line revenue
Identify potential out-of-stocks before they occur
Align distribution to maximize promotions
Preserve the data and functionality of legacy supply chain app (From Precima), and seamlessly integrate into the Activate platform.
Duration
4 Months
Team Role
Lead Product Designer
Target Audience
Supply Chain Managers,
Retail Operations Teams
Tools
Figma
Excel
Sisense
Jira
Problem
The existing Activate platform did not support supply chain data after the acquisition of Precima. Each retailer used fragmented BI tools (Qlik, Sisense, Highcharts), making performance tracking inconsistent and time-consuming.

Key challenges:
No unified data model for sales + inventory
Users couldn’t drill down dynamically (e.g., Brand → SKU → Store/DC)
Limited configurability and slow adoption of NIQ’s design system
Missing metrics critical to supply chain operations (Weeks of Supply, DC In-Stock %, etc.)
The existing Activate platform did not support supply chain data after the acquisition of Precima. Each retailer used fragmented BI tools (Qlik, Sisense, Highcharts), making performance tracking inconsistent and time-consuming.
Business Requirements


Research & Discovery
I partnered with product owners, data scientists, and BI analysts to analyze usage metrics and gather feedback from:
Category Managers (Retailers) – Needed visibility into SKU-level inventory and distribution issues
Brand & Supply Chain Managers (CPG) – Wanted to evaluate DC performance and vendor fulfillment
Marketing & Promotion Analysts – Needed to correlate campaigns with supply performance


Design Approach
Structuring the Data


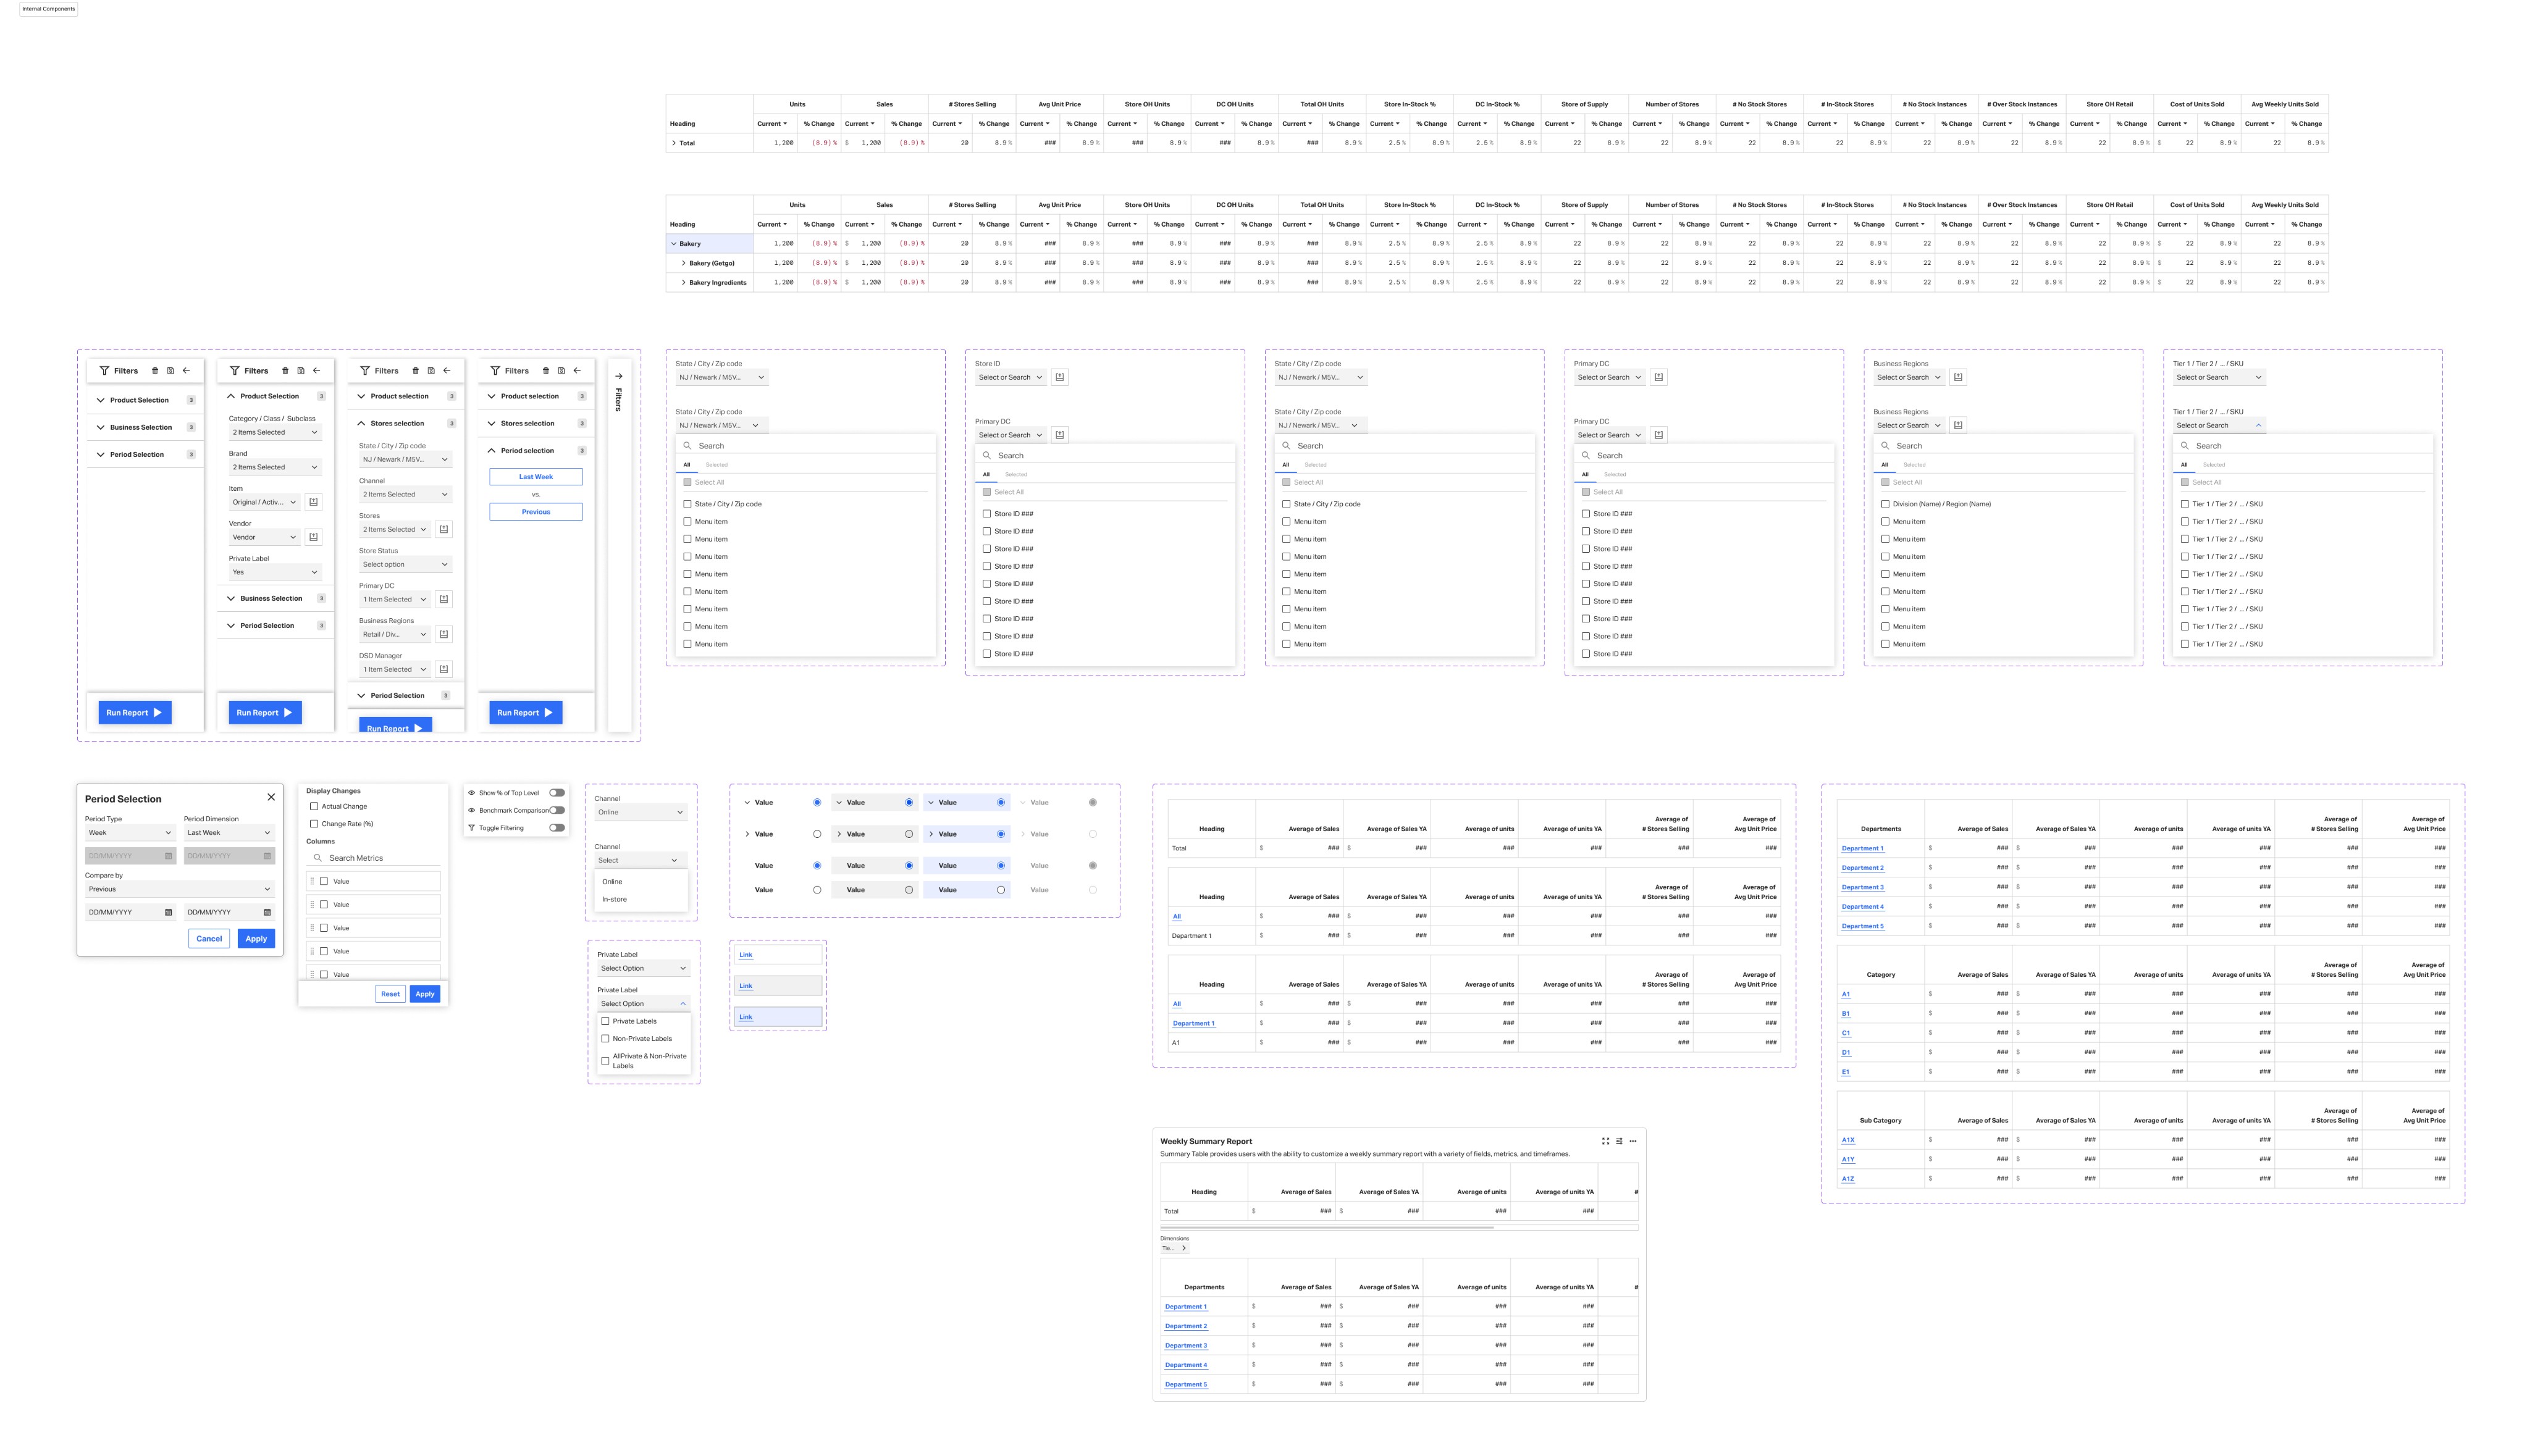
Low-Fidelity Blueprint
Designed low-fidelity (LFW) blueprints to define data hierarchy logic and user drill-down flows

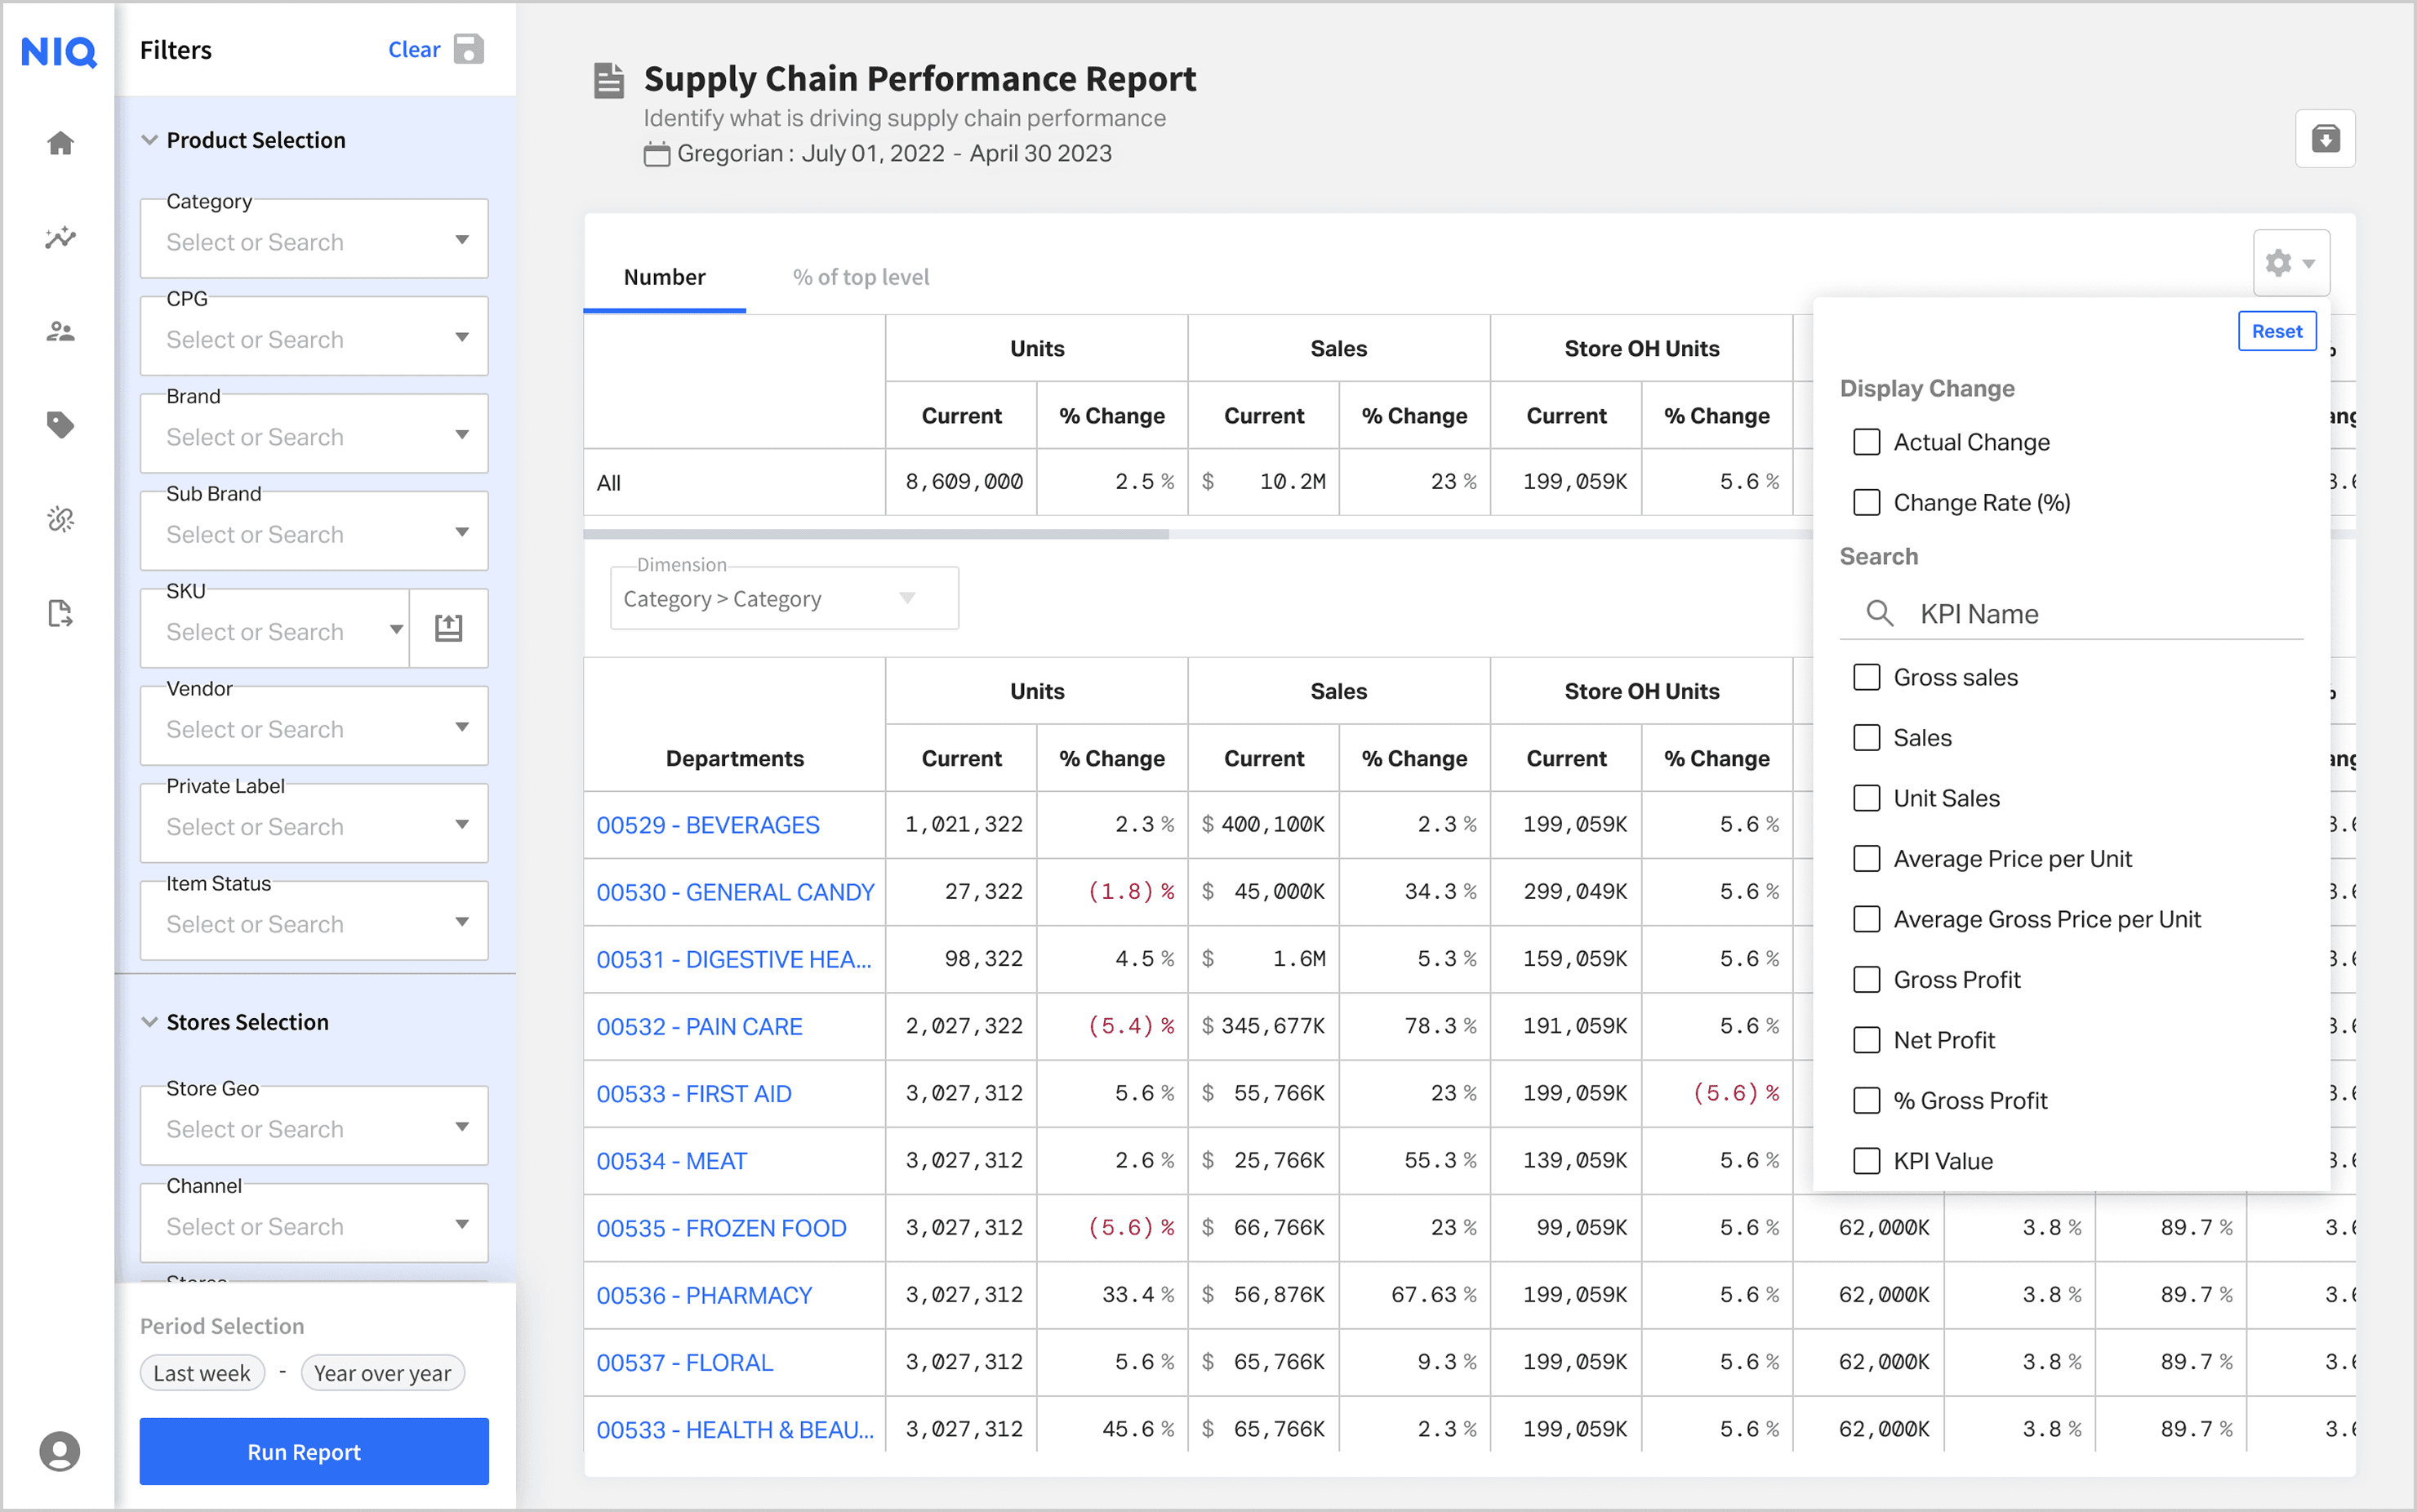
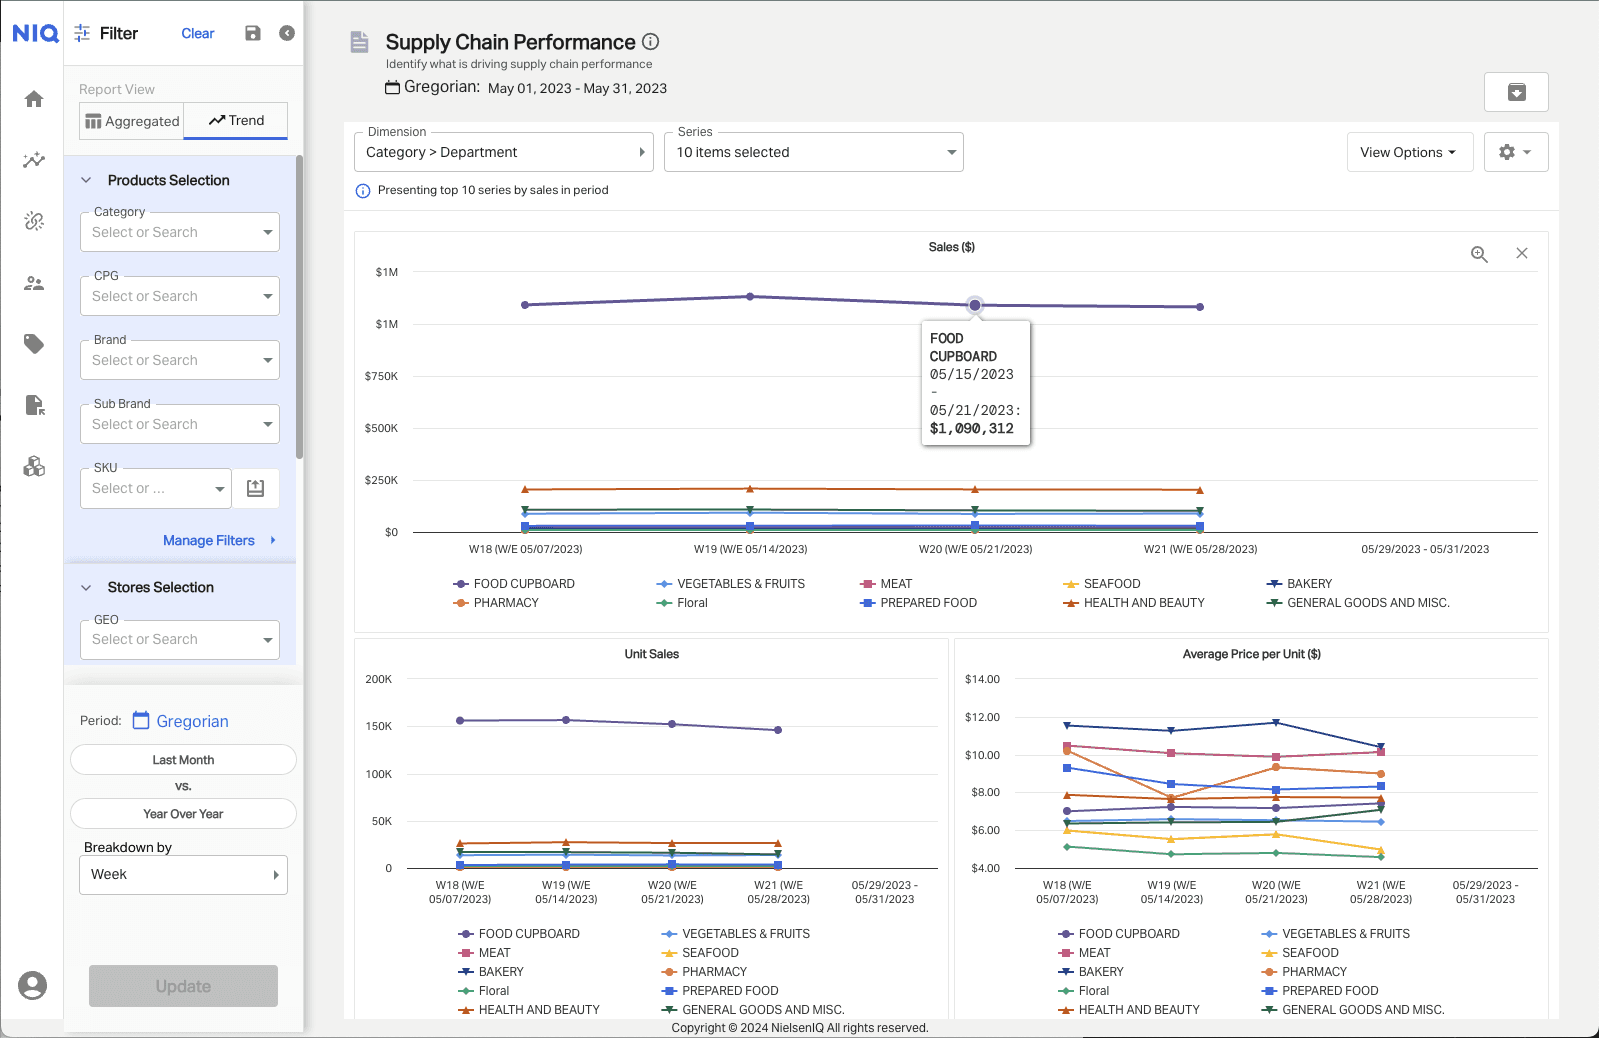
High-Fidelity Concepts
Designed low-fidelity (LFW) blueprints to define data hierarchy logic and user drill-down flows


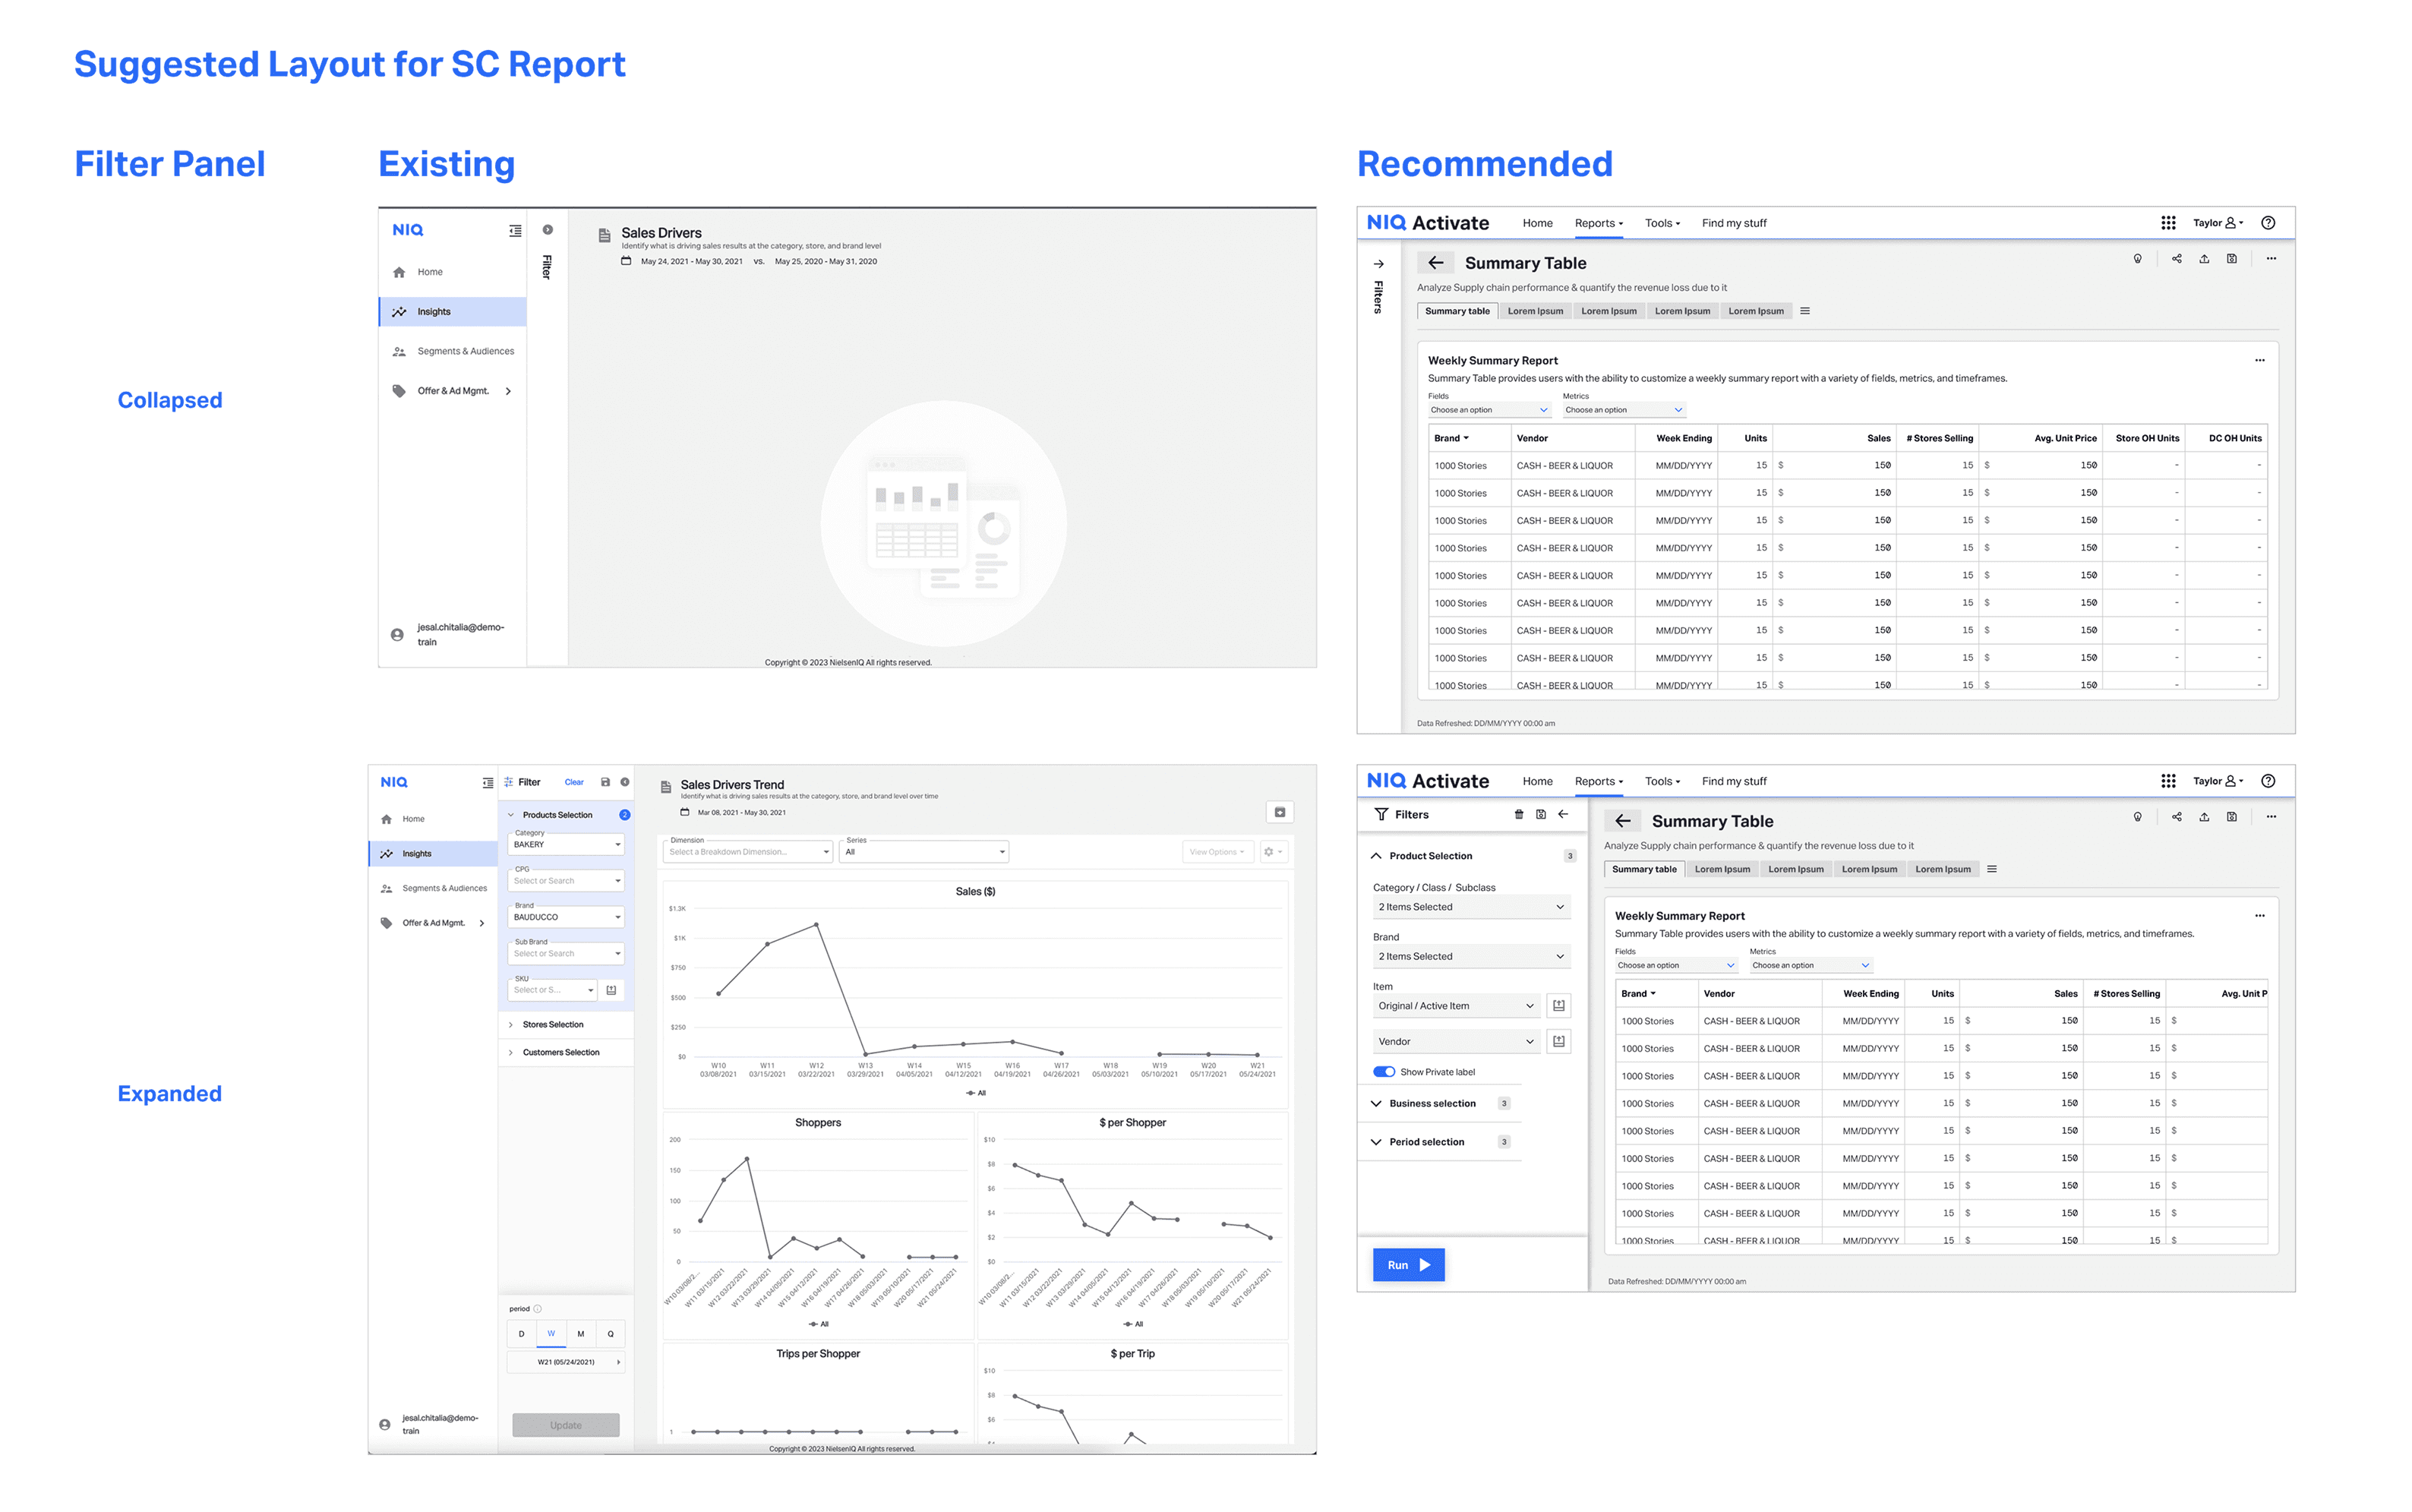
Design Alignment
After reviewing the high fi designs, the stakeholders wanted to stick with their existing design system of Activate


Collaboration & Delivery
Partnered closely with engineers and data scientists to translate UX logic into Sisense queries and front-end components. We ran multiple agile sprints to develop the report and validate real-time data performance before client launch.
Delivered the Supply Chain Performance Report to major retailers including Rite Aid
and Walmart, with built-in configurability and export capabilities.

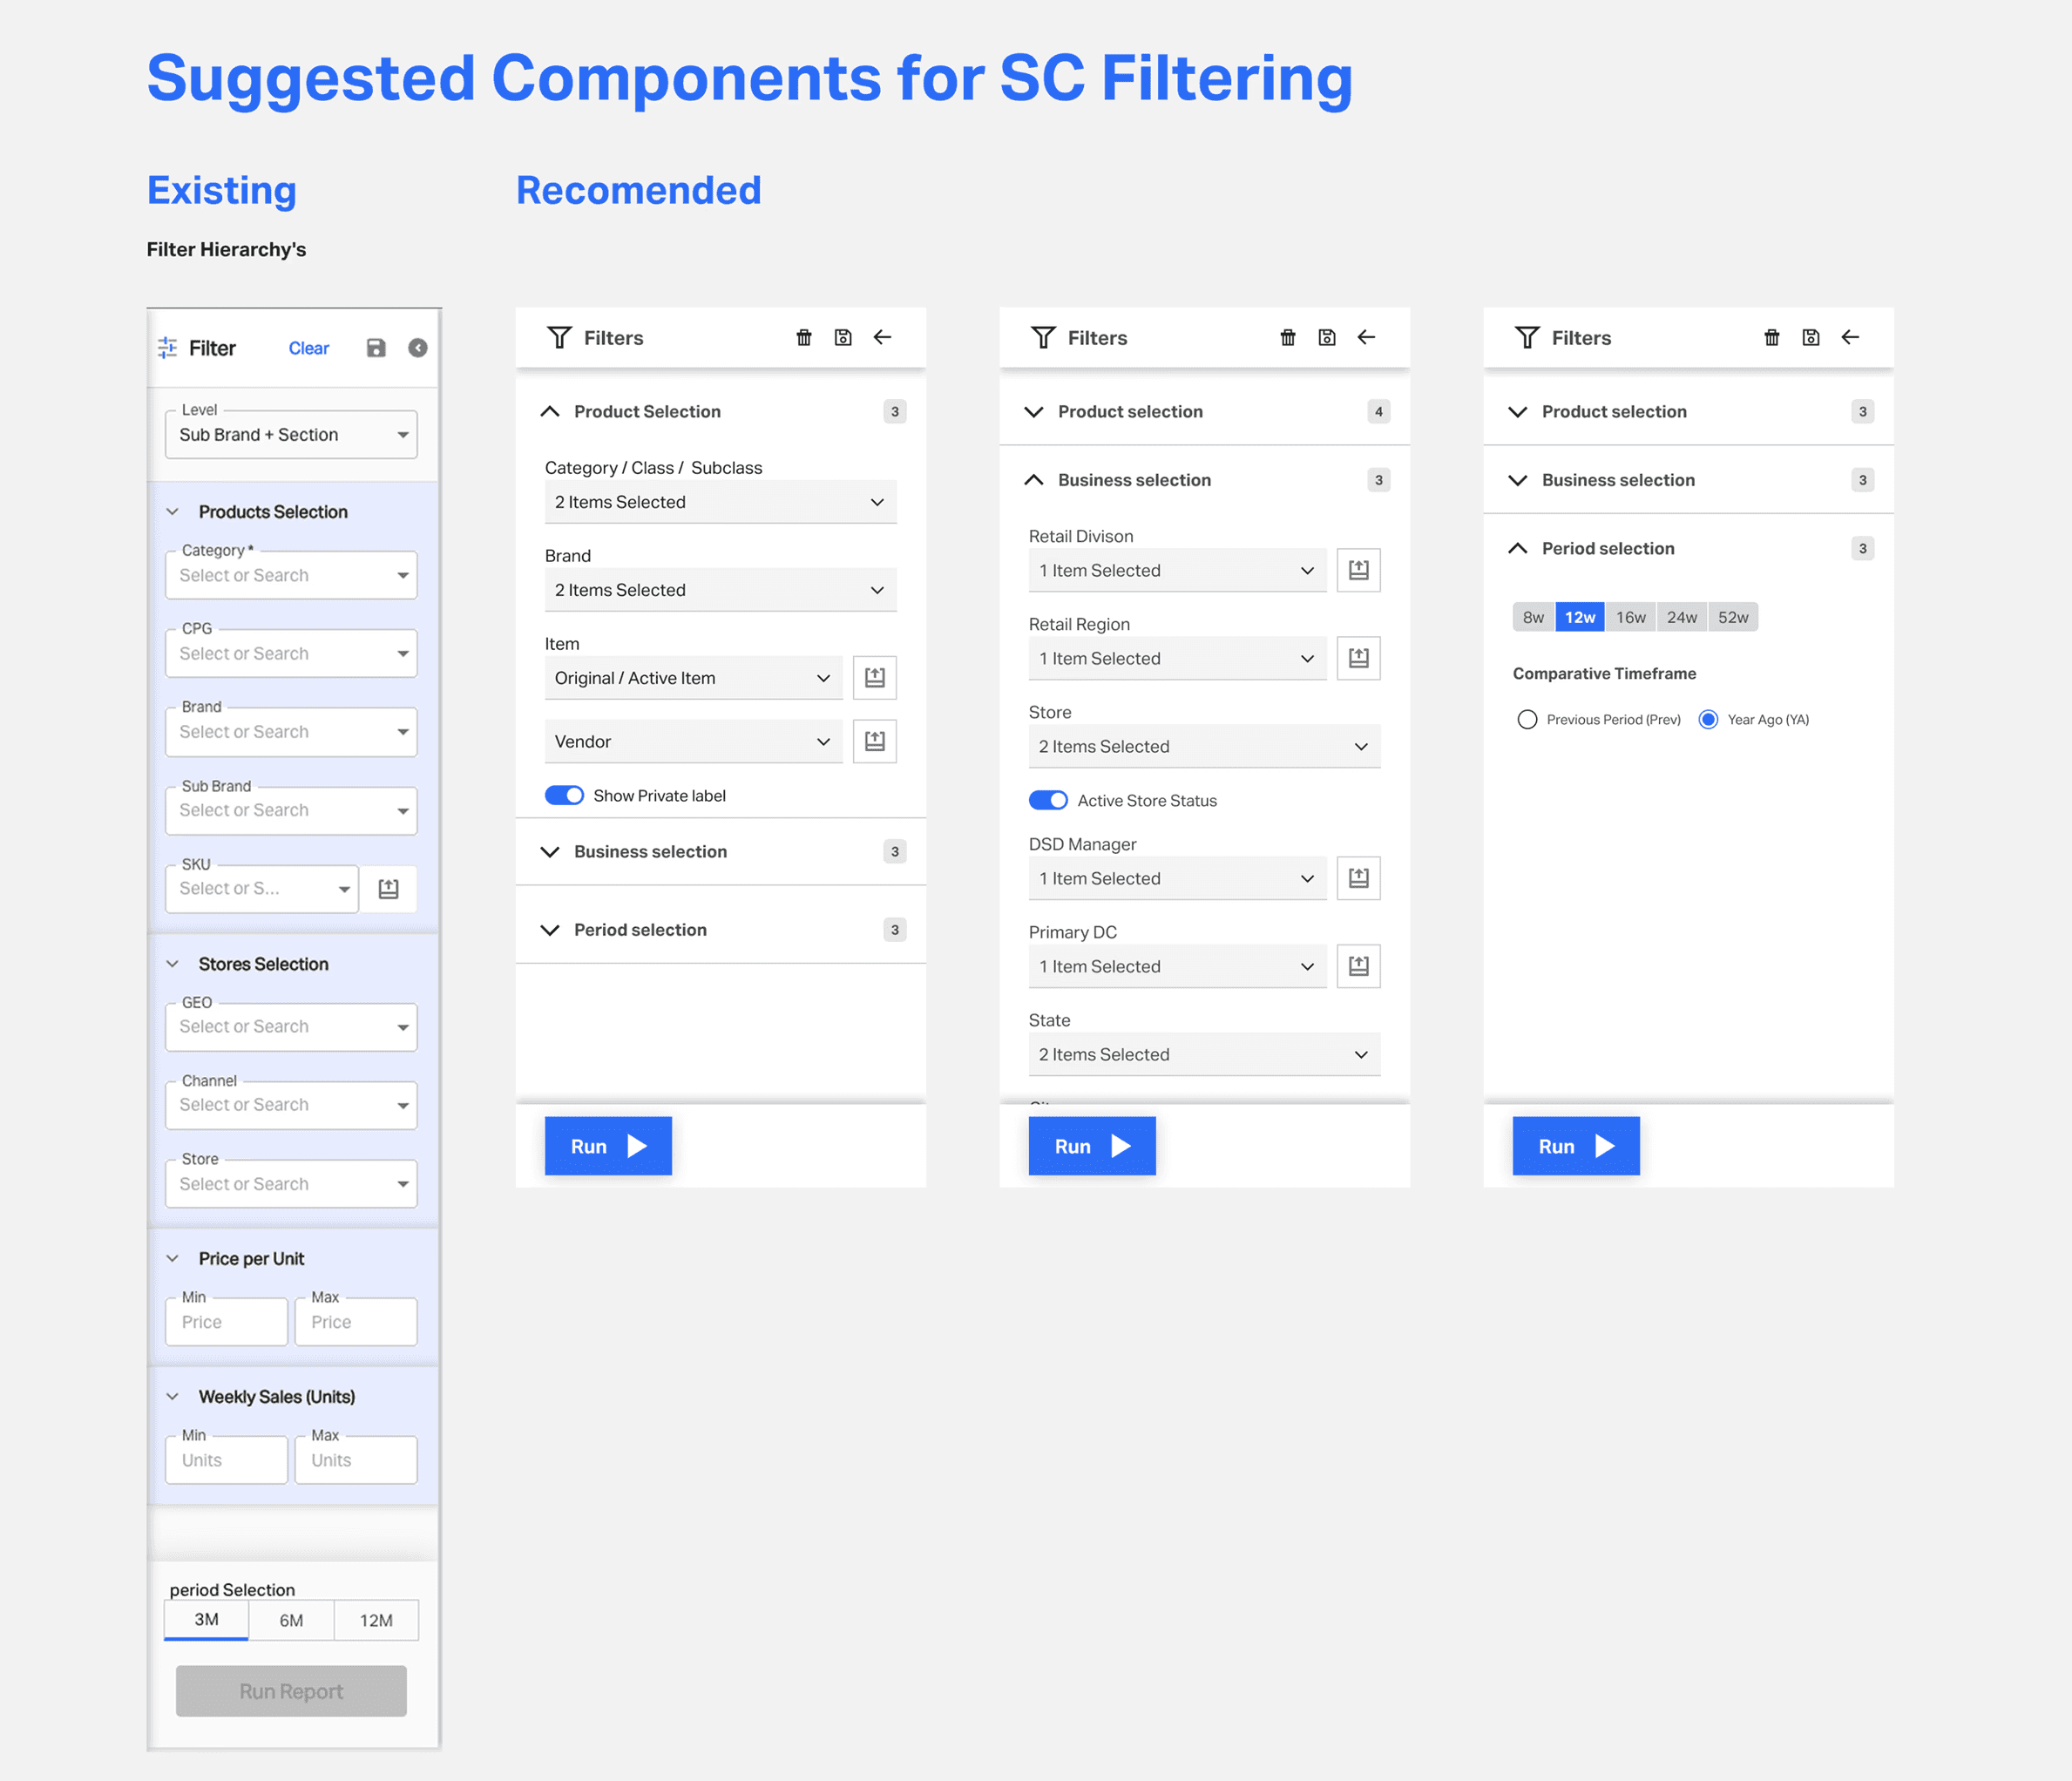
Design Artifacts
The design journey evolved through several fidelity stages — from data mapping to interactive prototypes.
Blueprints & Data Hierarchies: Mapped relationships across Product, Store, and DC dimensions to ensure accurate drill-down logic.
Wireframes: Defined the table hierarchy, KPI groupings, and filtering patterns for rapid iteration.
High-Fidelity Designs: Applied NIQ’s Activate design system to align with enterprise standards and accessibility guidelines.
Interactive Prototype: Built a live demo in Figma to validate data workflows, navigation, and drill-down interactions with internal teams and clients.
These artifacts helped bridge data complexity with design clarity, ensuring every metric was both actionable and human-readable.
Impact & Outcomes
Reduced report generation time by 60 %
Increased data consistency and usability across 12 retail clients
Enabled multi-hierarchical drill-downs with dynamic filtering
Accelerated adoption of NIQ design system across data applications
Reflection
This project taught me how to balance enterprise-scale data complexity with clarity and usability.
By bridging business requirements and technical constraints, we transformed supply chain reporting into an actionable, intuitive experience for analysts worldwide.
Next Case Studies
Brand Swap initiative
Creating an advanced analytical and AI-infused solution, which can quickly and preemptively prevent supply chain disruptions, maintain on-shelf availability, and improve future forecasting, planning and management.


